The spreadsheet tool has a set of simple instructions about how to use each tab. Follow these instructions carefully. Remember to start by making a copy of the “master” tool. Enter data into this copy and keep the master copy safe.
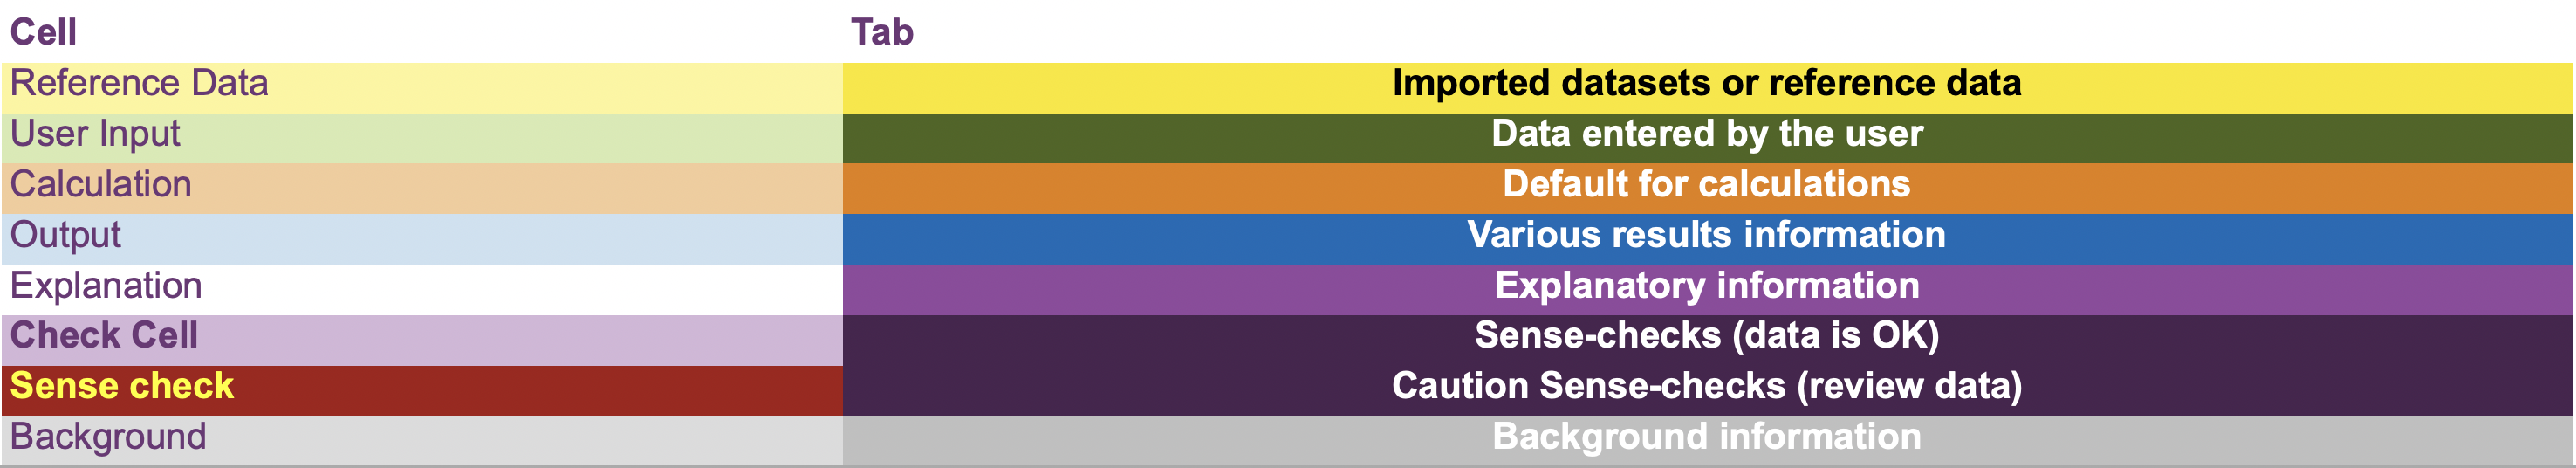
The tool uses a colour coding system. The instructions in the tool explain the coding.
The following steps provide an overview of the process for using the tools.
Step 1. Gather your data
The first thing to do is to review the data that your company already has collected as part of its GHG reporting activities. Check to see what you can use from these data sets in the spreadsheet tool.
You might find there are gaps or sets of information missing. We recommend you first try reaching out to your finance teams to see if they might have access to any missing data. The finance teams will deal with bill payments and are very likely to have records of payments for fuel use, and possibly mileage records. If the finance teams do not have the missing data you need, they might know who will have it. Estates teams may also have useful data sets, as well as fleet managers in the case of transport data.
Also check with the environmental managers, who are responsible for overseeing the environmental performance of companies for developing, implementing and monitoring environmental strategies that promote sustainable development. There might be an ESG manager – check with them.
Where might fuel use information be sourced from? The information could be available from meter readings, supplier bills/statements and sometimes delivery notes in the case of fuels like LPG and kerosene. Meter readings are the best data to use if they are available, as they are accurate, i.e. not estimated supplier bills. We can also presume that an exact quantity of fuel ordered and delivered by a supplier will be accurate.
Don’t rush to get the most detailed data that are necessary for the higher Tier calculations. Start with Tier 1, and if necessary, acquire the extra data you need to use the higher Tier 2 methods over time.
Step 2. Check your data
Before entering data into the tools, perform some basic checks on the data.
Some of the data you receive may have been checked quite carefully before. Try to find out who might have checked the data, and what checks they have made. Make a note of these.
You should always try and “sense check” the data you have been provided. It is hard to be prescriptive about how you should do this, but here is some guidance of the types of quality checks you could make:
- Completeness: Are the data sets complete? For example, are all the vehicles in the company’s car fleet included? Do you have annual data – for a full year? If not, then you can “scale up” to a full year or work with a different time period. Are all the NRMM machinery included? Who could you check this with? Is all the fuel use for heating included?
- Accuracy: It might be difficult to determine how accurate the data are that you have been provided. The tools have some automatic sense checks built in that will help detect “gross errors”. One typical problem is using the wrong units – for example, km instead of miles. Check to see if the correct type of fuel and technology have been selected. And in some cases, the data may be expressed in thousands or another multiple. Check these things carefully before you enter data into the tool.
Step 3. Enter your data into the tool
Enter your data into the tool.
The tool has several automatic built-in checks. The outputs of these are shown in the purple shaded cells. The results of these checks will help guide you to correct any potential errors with the input data.
The checks have been designed to work on an extended set of input data from a wide range of companies. Because of the in-built scope of the checks, they may be triggered even if the data you enter is “correct”. The checks could be triggered if for example your company activity is very different to an “average company”. If the sense check is triggered, take a few minutes to review your data and verify you have entered it correctly.
Step 4. Using the results
The tool provides results for each of the main sources (transport, heat and power, and NRMM). Detailed emission results are provided for each source along with damage costs (the monetised impact of your estimated emissions). There is also a summary of all sources that can be used to report your overall emission footprint.
The results can be exported from the tool and uploaded to this site to provide you with a footprint certificate and to enable sharing your results with others.
The results of the tool can help you and your company understand how large its air pollutant (AP) emissions are from a range of important sources. These AP data will complement the GHG emissions data that you are likely to have already compiled. A time series of results will show if emissions are increasing or decreasing, and the rates of change.
These data will allow some important comparisons and decisions to be made. For example, how similar or different are the results from your company to those of competitors? What steps might you take to reduce the AP and associated GHG emissions? These steps might also save significant sums of money if they are associated with a reduction in activity that is driving emissions but without affecting output or productivity.